
The complexities of a dynamic region like Western Sydney present myriad challenges to governments but spatial science can help service planning and delivery.
For tourists visiting NSW, Western Sydney might not be top of mind when it comes to photo opportunities but the region has become one of most dynamic and fastest evolving in the state, if not the country.
At almost 900,000 square kilometres and home to 2.3 million people, or 9 per cent of the population, Western Sydney is the largest urban sub-region in Australia.
It is the third largest economy in the country, with around 250,000 businesses.
Western Sydney is growing at a phenomenal rate on almost every indicator, with the population projected to exceed three million by 2036.
The region is remarkably diverse – 100 different languages are spoken, from 170 countries.
A whopping 60 per cent of new immigrants in Australia settle in Western Sydney.
Our understanding of this complex, evolving area needs to be scalable – from the very local level, at which most people engage with community, through to the regional level and beyond.
This is crucial for governments, service planners and providers of frontline services.
Spatial science, the broad domain where various professionals including geographers, cartographers and planners use spatial tools to support complex project management tasks, can provide that more detailed and scalable understanding, as we will illustrate here taking Western Sydney as an example.
A dynamic region
Western Sydney is becoming even more diverse in terms of population, employment, economic activity and the nature of human service needs.
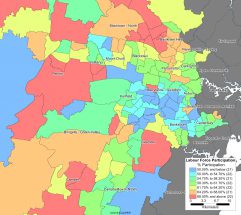
The following maps show just how deeply localised patterns of social factors are – including labour force participation, the need for assistance and unemployment.
The key feature is that demography drives demand for many important services and economic performance, positive and negative, drives much of what remains.
It’s important to emphasise that government action or inaction contributes to these patterns, not just at the national or state level but right down at the local community.
Caring work and need for care
The social dynamics of Western Sydney are substantial.
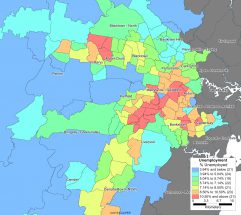
Employment is growing with 95,000 new jobs created between the 2011 and 2016 censuses.
However, unemployment and under-employment remain above the Sydney average. This pattern is not uniform across the region, as this map shows:
Of particular importance is an uneven pattern of need for assistance, often a proxy for ageing and disability, across the region, , as evidenced in this map:
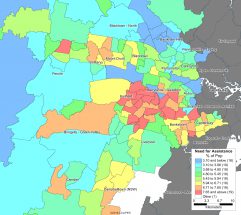
In addition, health and social care jobs have grown in Western Sydney from 91,000 in 2011 to 110,000 in 2016, with further expansion anticipated as services expand to meet current and projected need.
Some areas have ageing populations while others are characterised by growing numbers of children and adolescents. Disability affects more than 20 per cent of the population directly and many more indirectly.
Demographic patterns are a powerful driver for service demand now and into the future, with the added benefit many of these needs can be inferred and projected forwards based on census data and related official information sources.
Mapping the changes
One of the obvious problems with such a huge geographic area is monitoring both current and anticipated changes. These can range from the more obvious impacts of population growth and housing demand through to rising average urban temperatures and the availability of and access to resources such as green and blue spaces.
Add to this the need for an expanding infrastructure – such as power, water and transport – and those complexities can only grow and increasingly interact.
One technology for managing this is geographic information software (GIS) which aids governance and management of complex scenarios at multiple levels of granularity.
For example, GIS software can be used to collect, manage and analyse multiple data sets about population, service provision, finances, infrastructure, land types, employment and even climate data – all within the one system.
Effective governance in complex times
here has been a lot of talk about smart cities, much of which assumes a rapid increase in various digital technologies, especially monitoring and surveillance systems.
But urban geography and GIS technology already permit a high level of ‘smartness’ if applied appropriately.
The key issue is the smart use of data we already have, not simply a process of ever-expanding data collection systems, data warehouses and employment of data professionals.
Those are all expensive options, however appealing.
Smart is different from simply ‘more’, and it’s already been noted that community engagement is central to any smart city environment.
The real concern is having access to actionable data for improving the practical operation, liveability and long-term sustainability of our urban environments.
Western Sydney provides a clear example of the kind of complexities that cities are facing, now and into the future. The smartness needed here is an intersectional one that connects people, places and practices at multiple levels of scale – smart equals integrated.
Spatial science offers support
Ultimately, spatial science and integrated mapping analysis offer significant supports to managing this level of social and systemic complexity.
Understanding population demographics and location, levels of support or need, and the early identification of emerging concerns, can all be modelled and mapped in a GIS system.
Information can be visualised using digital maps and visualisation methods.
These are the types of technological trends that offer enhanced governance capabilities and improved systemic planning to better manage emerging urban complexities.
It is now abundantly clear that governments of the future, from local to national, will be increasingly sophisticated in spatial science applications.
Hamish Robertson is a research fellow at the Centre for Health Services Management, University of Technology Sydney, and Nick Nicholas is managing director of the Demographer’s Workshop in Sydney.
Comment below to have your say on this story.
If you have a news story or tip-off, get in touch at editorial@governmentnews.com.au.
Sign up to the Government News newsletter